The Alcohol and Drug Information Centre (ADIC), where I have the privilege of serving as Executive-Director, carries out a spot survey to determine the trends in consumption of alcohol since 1998. It is conducted in 10 districts in Sri Lanka biannually in the months of July and December. 8 districts are constantly surveyed as these districts consist of high population and/or they are commercial districts.
These constant districts are Colombo, Gampaha, Galle, Kegalle, Anuradhapura, Kandy, Jaffna and Batticaloa. The remaining two districts are chosen randomly. Each sample consists of males 15 year of age and above and the sample size is 2,500. The survey reveals the main reasons behind the initiation, the age of initiation and patterns in consumption of alcohol.
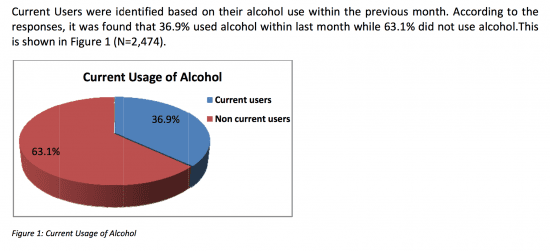
36.9% of the sample population is current alcohol users while the highest percentage was recorded from the district of Galle (43.3%) and lowest from the district of Jaffna (29.6%).
However, plotting the data collected over the years since 2000 to 2013, we can observe a trend of decreasing alcohol use.
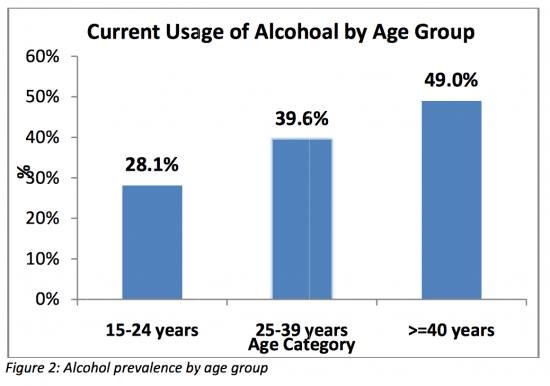
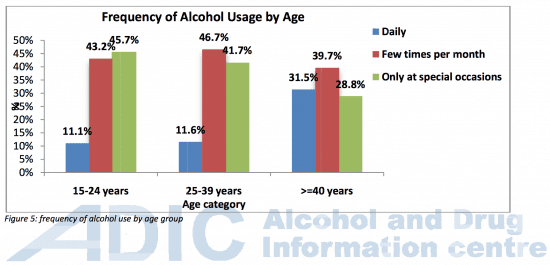
The majority of the current alcohol users were found to be among those belonging to the age group of above 40 years (49.0%). But we have to say that there are too many minors being exposed to and using alcohol. This is a threat to the development of Sri Lanka.
On average, daily users spend Rs 6493.00 per month. This is a huge amount and a clear sign for how alcohol use contributes to poverty. The minimum wage in Sri Lanka is Rs 6500.00 per month. The average monthly per-capita income is Rs 11,932. And the average monthly household income in Sri Lanka is Rs 46,207.
I think that these are crucial figures. My fellow Sri Lankans who are using alcohol spend too much of their income on this harmful substance. But the positive trends we can see in the Household income and expenditure survey 2012/13 is that households spend less on alcohol and other drugs compared to 2009.
On average, use of alcohol is initiated at age of 20 years.
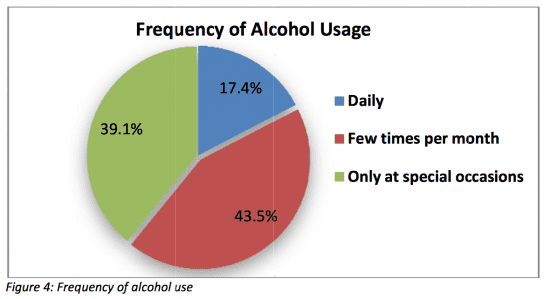
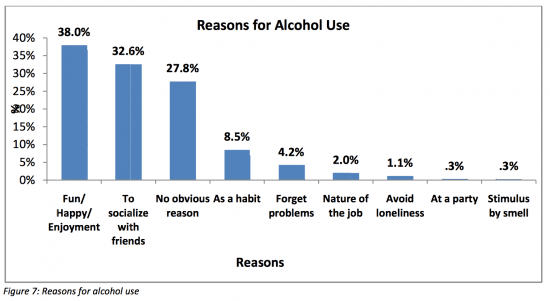
The highest percentage of alcohol users use daily (17.9%). The highest percentage of responses on daily use was from the district of Vavuniya (64.8%). The majority (38.0%) have mentioned that they use alcohol for fun or to be happy while 32.6% revealed that they use alcohol to socialize with friends.
I think it is interesting to know that out of the current alcohol users 41.4% have tried quitting alcohol use. 28.0% of the people have attempted to quit alcohol use because of health hazards and the price of alcohol. 25.7% of them have attempted to quit because of financial problems/ cost of alcohol. Some have attempted to quit as they believed its useless or stupid to consume alcohol (13%). According to the respondents, 58.1% have ever used alcohol while 41.9% did not. Majority of the never users of alcohol (28.2%) mentioned that never used alcohol because they dislike the product and due to unpleasant attitude towards alcohol.
So, we see in Sri Lanka the trend going into the right direction towards more freedom for people, better health and societal development. For sure our work with ADIC is having an impact and for sure the Parliament Act on Alcohol and Tobacco Control from 2006 shows results.
But we also have more work to do: we need to protect children and young people better; we need to support those more effectively who wish to quit using alcohol; we need to protect decision-makers from the aggressive lobbying of the alcohol industry and we need to make sure that both prevention and policy responses are improved.
—
For further reading:
Department of Census and Statistics: Household income and expenditure survey 2012/13
ADIC Trend Survey on Alcohol
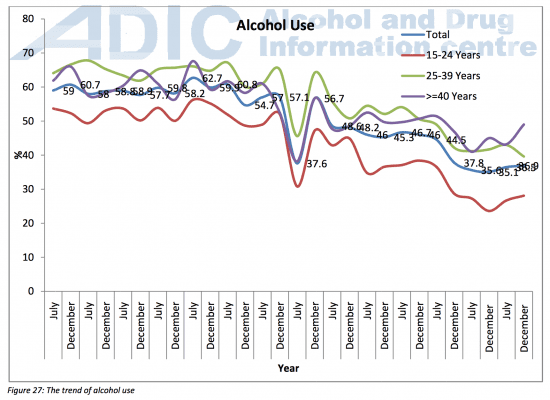
Encouraging to see the ADIC Research data showing Alcohol consumption is declining in Sri Lanka from 2010. I appreciate the good work of ADIC-Sri Lanka in this direction.
But however, the Government Official Excise Figures from Sri Lanka are showing an alarming increasing trend in Alcohol Sales and Revenue during the same period. Wondering why the declining consumption trends are not reflecting in the Sales Figures over these years. Can anyone explain?? Is the Government Figures a boosted one ???