Mapping the Lobbying Footprint of Harmful Industries: 23 Years of Data From OpenSecrets
Original Scholarship
Abstract
Policy Points
- The study reveals the similarities and differences among the lobbying activities of tobacco, alcohol, gambling, and ultraprocessed food industries, which are often a barrier to the implementation of public health policies.
- Over 23 years, the researchers found that just six organizations dominated lobbying expenses in the tobacco and alcohol sectors, whereas the gambling sector outsourced most of their lobbying to professional firms.
- Databases like OpenSecrets are a useful resource to monitor the commercial determinants of health.
Context
Commercial lobbying is often a barrier to the development and implementation of public health policies. Yet, little is known about the similarities and differences in the lobbying practices of different industry sectors or types of commercial actors. This study compares the lobbying practices of four industry sectors that have been the focus of much public health research and advocacy: tobacco, alcohol, gambling, and ultraprocessed foods.
Methods
Data on lobbying expenditures and lobbyist backgrounds were sourced from the OpenSecrets database, which monitors lobbying in the United States. Lobbying expenditure data were analyzed for the 1998–2020 period. The researchers classified commercial actors as companies or trade associations. The researchers used Power BI software to link, analyze, and visualize data sets.
Findings
- The ultraprocessed food industry spent the most on lobbying ($1.15 billion), followed by the gambling ($817 million), tobacco ($755 million), and alcohol industry ($541 million).
- Overall, companies were more active than trade associations, with associations being least active in the tobacco industry.
- Spending was often highly concentrated, with two organizations accounting for almost 60% of tobacco spending and four organizations accounting for more than half of alcohol spending.
- Lobbyists that had formerly worked in government were mainly employed by third-party lobby firms.
Conclusions
This study shows how comparing the lobbying practices of different industry sectors offers a deeper appreciation of the diversity and similarities of commercial actors. Understanding these patterns can help public health actors to develop effective counterstrategies.
Background
The definition of commercial determinants of health (CDoHs) set out in The Lancet 2023 series recognizes that commercial actors are diverse and have different impacts on health. Yet too often, public health advocates fail to make these distinctions, referring to “the industry” or “corporations” as a proxy for harmful commercial actors. This lack of nuance stymies efforts to develop a science of commercial determinants.”
Chung H, Cullerton K, Lacy-Nichols J. Mapping the Lobbying Footprint of Harmful Industries: 23 Years of Data From OpenSecrets. Milbank Q. 2024 Jan 14. doi: 10.1111/1468-0009.12686. Epub ahead of print. PMID: 38219274.
This study compares commercial actors based on their portfolio. The researchers also differentiate between individual companies and industry trade associations, a distinction that is often missing in empirical studies of political activity. Beyond this paper’s conceptual focus on commercial actor diversity, the study also investigates which characteristics of commercial lobbying are feasible to capture at scale. This way, the study supports efforts to systematically monitor the CDoHs.
This study focuses on one commercial activity: lobbying. Lobbying is one of several political strategies that commercial actors use to influence policymaking.
Alcohol industry-specific findings
The researchers reviewed all clients in the OpenSecrets data set (n = 1,047) and assigned each client to a single industry classification. Although they mainly relied on the classification and naming scheme applied by the OpenSecrets database, in nine cases, a company or trade association was classified to more than one sector. For example, the OpenSecrets database classified alcohol company Diageo, PLC, as both food and drink (1998-2000, $6,161,728 total) and alcohol company (1998-2020, $48,860,519 total). This reflects the company’s portfolio diversity at the time (for instance, in 1998, Diageo owned Burger King among other companies).
To explore whether market share helped to explain lobbying activity, the researchers matched the companies in the OpenSecrets database to Euromonitor market share data. The researchers identified 12 relevant Euromonitor market share data sets for alcohol (alcoholic drinks), UPFs (snacks, soft drinks, staple foods), and tobacco industries (cigarettes, cigars and cigarillos, e-vapor products, heated tobacco, smokeless tobacco, smoking tobacco, tobacco-free oral nicotine, tobacco heating devices). Although some data sets covered a longer period, all covered the years 2013–2020. For each data set, the researchers documented the 20 companies with the largest market share for each year. For the years 2013–2020, the researchers identified 25 alcohol companies, 70 UPF companies, and 26 tobacco companies. The researchers then searched for these companies in the OpenSecrets data using to create a matched list.
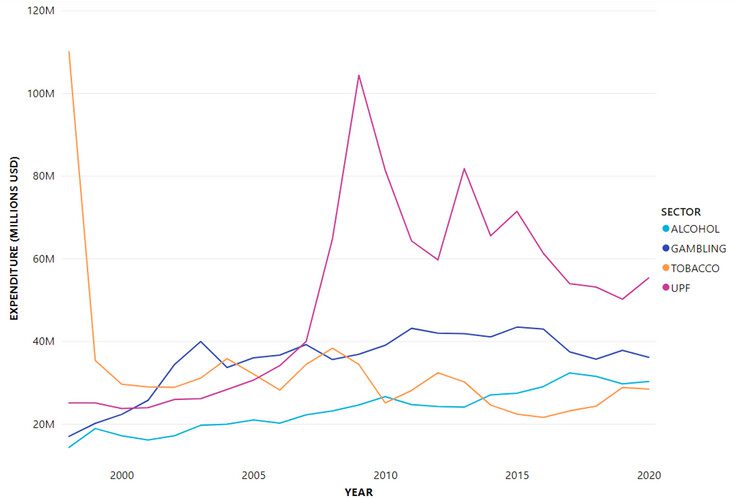
Between 1998 and 2020, the alcohol, gambling, UPF, and tobacco industry sectors spent approximately $3.26 billion on lobbying in the United States (adjusted to 2020 values). This comprises 5.7% of total lobbying expenditure in the United States for this time period (approximately $56.7 billion). The UPF industry spent the most ($1.15 billion), followed by gambling ($817 million), tobacco ($755 million), and alcohol ($541 million).
Spending over time has varied for each sector (Figure 1). Tobacco expenditure peaked at over US $110 million in 1998, dropping to just over US $35 million in 1999. Since then, its spending has ranged between $20 and $40 million annually.
Alcohol spending was the lowest in 1998, and has steadily increased over time, but remains low overall relative to the other sectors (its highest expense was $32 million in 2017).
Gambling expenditure more than doubled between 1998 and 2003 and has ranged between $35 and $45 million since then. UPF spending peaked in 2009 ($104 million) and has decreased since then, with smaller peaks in 2013 and 2015.

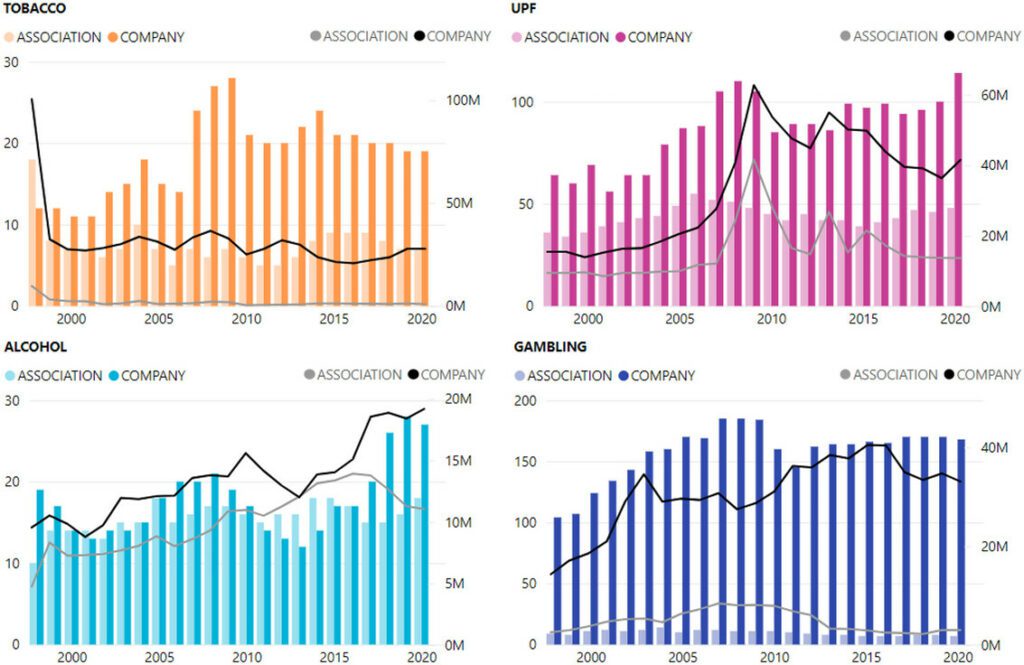
Differences in lobbying spending could be observed within each sector. Although companies spent more than trade associations on lobbying overall, comprising 77% of all spending on average, this ratio varied by sector. Trade associations were most active in the alcohol industry (43% of total expenditure), followed by UPF associations (32%), gambling (14%), and tobacco (5%).
The number of companies and associations engaged in lobbying differed across sectors and over time. The UPF industry had the highest number of unique clients engaged in lobbying between 1998 and 2020 (n = 462), followed by gambling (n = 351), alcohol (n = 109), and tobacco (n = 86). For all sectors, the number of clients engaged in lobbying surged between 2007 and 2009, after which tobacco and gambling clients decreased, whereas alcohol and UPF clients increased. There was not always a correlation between the number of clients engaged in lobbying and the total amount of money spent.

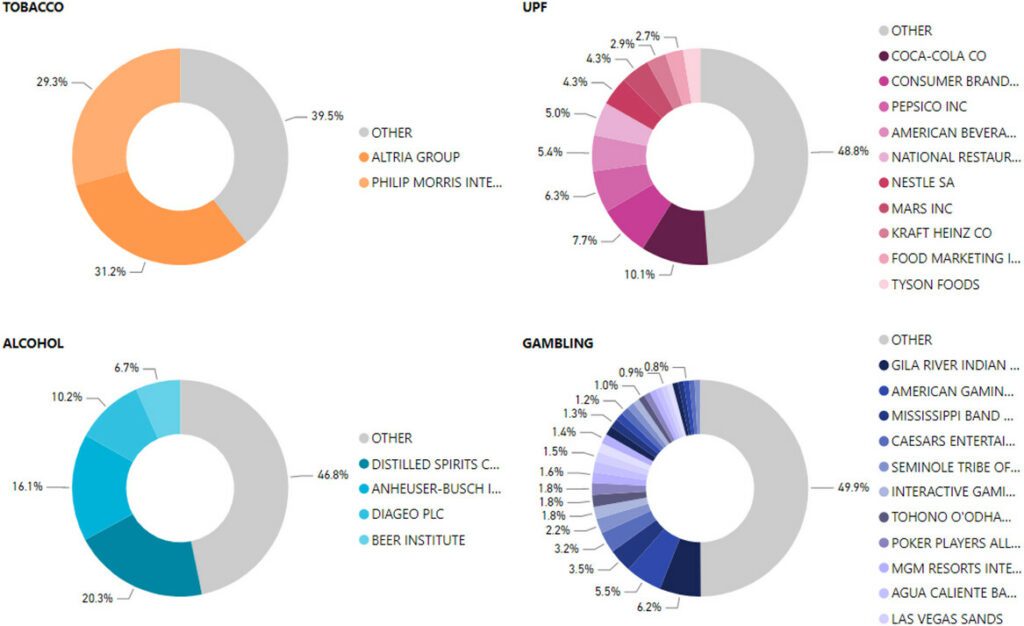
The researchers also investigated which clients had the highest expenditures and whether this was stable over time (Figure 3) within each industry. They found that the tobacco industry displayed the highest degree of concentration, with two clients accounting for over 60% of all spending (Altria Group, 31%; Philip Morris International, 29%). The other sectors displayed less concentration, with the top 50% of spending spread across four clients in the alcohol industry, 10% in UPFs, and 30% in the gambling sector.
From the alcohol lobby, the four actors with the most aggressive lobby activity were:
- DISCUS,
- AB InBev,
- Diageo, and
- the Beer Institute.
The researchers found that market share mattered most for lobbying spending in the alcohol industry.
Of the companies with the largest market share in the tobacco, alcohol, and UPF sectors, only a portion were documented as spending money lobbying in the OpenSecrets database:
- 15 (60%) of 25 alcohol companies,
- 14 (54%) of 26 tobacco industry companies, and
- 36 (51%) of 70 UPF companies lobbied.
However, these companies accounted for a substantial percentage of total company lobbying expenditure. Between 2013 and 2020 (the years for which the researchers had market share data), the largest market share companies accounted for approximately 66% of tobacco company lobbying expenses, 90% of alcohol company lobbying expenses, and 64% of UPF company lobbying expenses, though this varied year to year.
Lobbying practices of the top two companies and trade associations in the alcohol industry
Concerning the amount spent on each category of lobbyist, the alcohol industry had a ratio of 71% of lobbying spending allocated to in-house lobbyists.
All industries hired far more third-party lobbyists overall, despite spending more on their in-house lobbyists, with third-party lobbyists comprising 95% of all gambling industry lobbyists, followed by tobacco (91%), alcohol (87%), and UPF (78%).

Conclusions
Of significant concern for countries that do not require recording of in-house lobbyists as part of lobbying disclosure requirements is the study finding that most of the sectors used in-house lobbyists instead of the third-party firms. This means that many countries are missing most lobbying activities. This urgently needs to be addressed.
Similarly, industry trade associations, via their not-for-profit status, are sometimes excluded from lobbying regulations. In light of the substantial amount of lobbying that industry trade associations provided, especially in the alcohol and UPF industries, this is another loophole that needs to be urgently reviewed to provide better transparency. Disclosure requirements in many countries could also be strengthened to require a more complete record of meetings with members of Congress, the executive branch, congressional staff, and the bureaucracy. Several governments require detailed contact logs of lobbyist meetings, such as Chile, Ireland, and Canada, though ensuring compliance with the law is an important challenge.
There are many other forms of direct and indirect political advocacy that the study did not capture, such as political donations or grassroots lobbying, in which those missing companies may be active. Indirect political advocacy (e.g., in which companies fund a think tank or association to lobby on their behalf) is especially opaque. Many of these think tanks and associations are structured as nonprofits and are exempt from financial disclosure requirements in the United States – limiting information about who funds them. Research suggests that some companies use so-called “dark money” or hidden forms of advocacy (e.g., lobbying through organizations not subject to disclosure requirements) to avoid reputational damage when supporting causes antithetical to their public positions.
Some health harmful companies may lobby via multiple channels: one channel being their own in-house lobbyists but also via the many trade associations in which they are members.
Some health harmful companies possess considerable lobbying power without having lobbyists employed. Many chief executive officers (CEOs), senior-level staff, and board members of companies will undertake “lobbying” as part of their day-to-day work. These senior executives will often have far greater access to policymakers than professional lobbyists do, as they have inherent power through the significant financial assets they bring to the country. For this reason, policymakers will often prioritize meetings with these individuals.
By comparing the lobbying practices of four health harmful industry sectors, this study has helped to reveal the differences and similarities in how four industries engage in political activities. By building a better understanding of the strategies each industry sector uses, public health advocates may be better prepared to challenge the political opposition that these industries often present to public health policies.

